News Archive
Market Talk - 2018 october
Sign up to receive market talk updates in your inbox each day.

Largest Losing Month For Oil & US Equity Markets
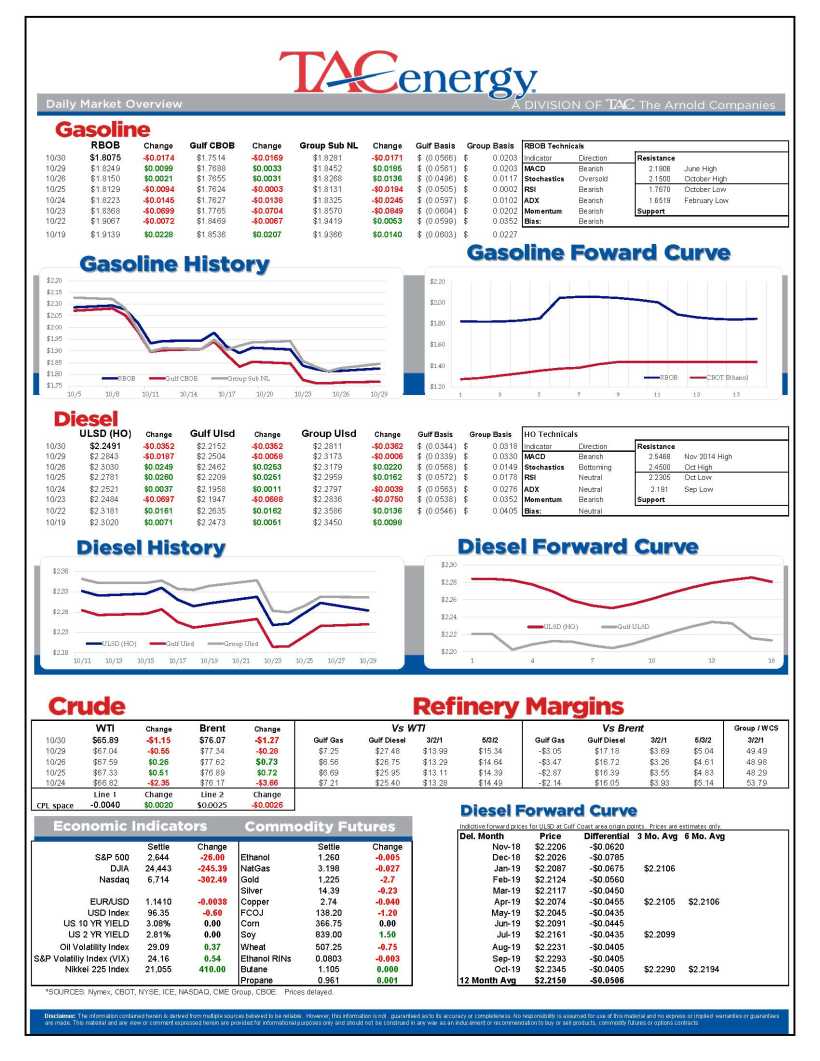
Energy futures are were trading modestly higher to start the last trading day of what will likely go down as the largest losing month for Oil & US equity markets in the past 2 years. (As this was being written oil & gasoline futures dropped into the red) The good news for investors is that US stocks are staging a more substantial rally, adding nearly 4% since bottoming out earlier in the week.
After trading nearly in lockstep during the sell-off earlier in the month, equity and energy prices have been trading more independently over the past couple of weeks, although part of that detachment appears to be the large moves in equities that have been coming later in the afternoon once energy prices have already posted their settlements for the day.
The API was said to show a build in crude oil inventories of 5.69 million barrels, while refined product inventories both decreased by more than 3 million barrels on the week. The DOE’s weekly report is due out at 10:30 eastern.
As we look ahead to November trading, the two big questions remain how stock markets will act, and how the physical oil market will handle the Iranian sanctions that officially kick in 4 days from now. From a chart perspective, things are looking pretty bearish as long-term trend-lines have been broken, opening the door for another $5-6 drop in oil and 10-20 cent drop for refined products over the next few weeks.
CLICK HERE for a PDF of today's charts
Leader in the clubhouse for best “Face in hand Trader” of October.

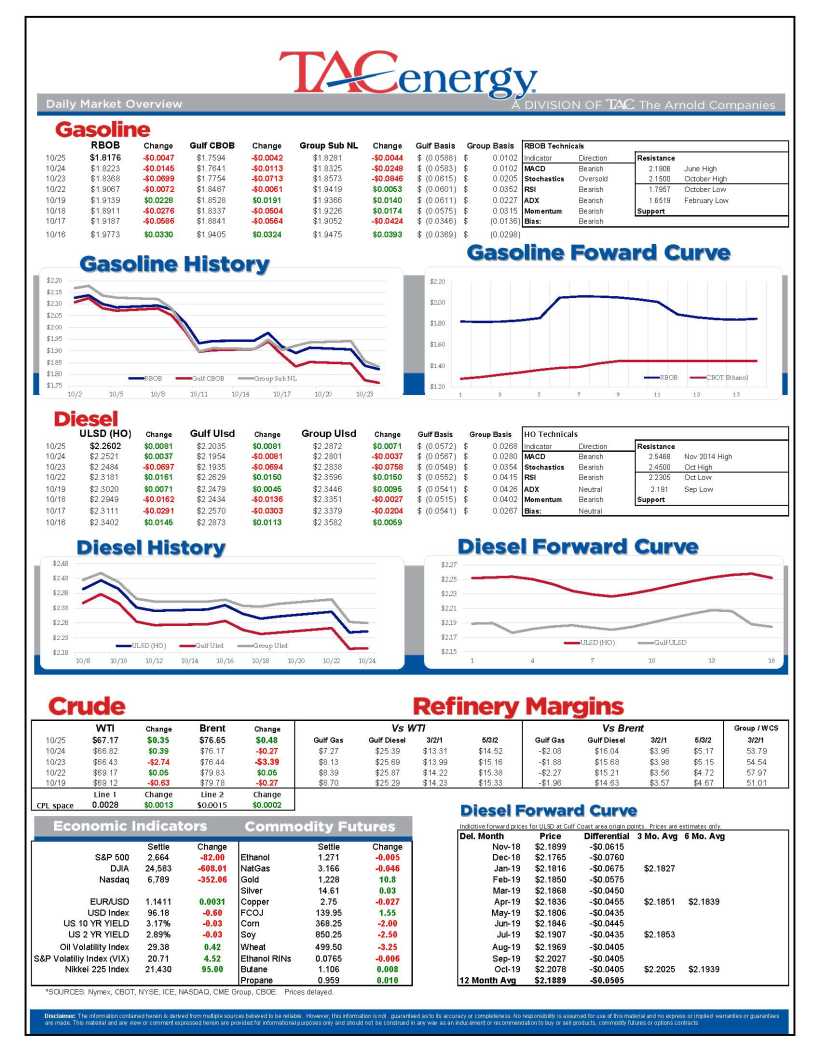
Energy Futures Moving Into Red Again
Energy futures are moving into the red again this morning, threatening their October lows, as fears shift rapidly from the world facing a shortage to an excess of oil supply, and as equity markets around the world remain on shaky ground.
It’s a bit unusual to see ULSD futures leading the move lower as the diesel contract is the only 1 of the big 4 petroleum futures to still be trading above the bullish trend-line that started last July. RBOB gasoline futures meanwhile still look the most bearish after wiping out 8 months’ worth of gains in just the past 4 weeks.
WTI and Brent are both on the cusp of a bearish outside-down pattern for the month of October (setting a higher high, then a lower low than previous month’s trading) which is known as a classic sign of a trend reversal and could spell more downside ahead.
As the charts below show, the October Sell-off has all come in the front 12-18 months of the forward curve, with values for both Brent and WTI actually moving higher 2 years and further out. That move from steep backwardation to contango in the front months is reflective of short term supplies being able to cover the expected declines from Iran and Venezuela, while doubts linger about the long term options to keep up with global demand.
(https://s3-us-west-2.amazonaws.com/cosmicjs/6fbb3a50-dc47-11e8-9320-2da6beaa5183-Market_Talk _1030.pdf)

Energy Futures Follow Lead Of Equity Markets
Energy futures continue to follow the lead of equity markets in a volatile week that pushed several of the most-watched indices and contracts to 6 month lows. Thursday’s session saw a strong rally in stocks help oil and diesel prices bounce off of multi-month lows, only to pick up the selling again overnight after disappointing earnings reports from several of the world’s largest technology companies.
Meanwhile, the guesses stories surrounding the upcoming sanctions against Iran are reaching a fever pitch this week, with reports that the US may be hesitating on how it will regulate international financial transactions via the SWIFT network, China apparently making a U-turn in its stance and telling its oil companies to avoid Iranian crude, all while the Iranians race to insulate their population from economic fall-out.
So what really matters in all of this? Over the next few months we’ll find out just how well the world’s major oil exporters can step in to replace the barrels that Iran can no longer sell. As the chart below shows, based on the increases from the US, Saudi Arabia and Russia this year, the total decline in global production may be minimal – even when factoring Venezuela’s collapse into the equation. If that proves true it could spell more downside for energy prices, with the billion dollar caveat of whether or not the new oil production can get from where it is to where it needs to be.

Energy Futures Treading Water
Energy futures are treading water this morning after once again being caught up in a stock market sell-off Wednesday afternoon. The weekly DOE report offered a little something for both the bulls and bears to enjoy, but ultimately the fundamentals couldn’t outweigh the influence of fear that’s gripped many markets lately.
For a while during Wednesday’s session, it appeared that energy prices had found a temporary floor and may be set for a rally. Gasoline prices got a boost immediately after the DOE report, as a draw in total inventories of almost 5 million barrels on the week gave hope that the glut of supply building along the eastern half of the country may be diminishing.
Reality seemed to set in later in the day however, as refinery production continues to far-outweigh domestic gasoline consumption, and stocks remain above their seasonal range for this time of year. When the dust settled, most gasoline prices were trading at 6 month lows to end the formal session, and then got caught up in the afternoon equity collapse to add to the daily losses.
In other news, Chevron & the EPA reached a $150 million settlement agreement to improve safety and air quality concerns following various refinery incidents over the past 6 years.

